
Higher Education Benchmarking 2020
Introduction
This report is the third version of the UK Higher Education (HE) Benchmarking report. It will take an in-depth look at Higher Education in this respect, covering a broad range of issues from technology and metrics, through to employee development and customer engagement. Not only will this give us the opportunity to benchmark and spot trends in the HE industry, but it will also allow us to compare how universities function and perform with other industries, and where these factors may differ.
This report provides comparisons, where appropriate, with the results of the 2016 Higher Education Benchmarking report and the v.9 Benchmarking report. The Higher Education Service Desk Benchmarking survey was distributed to Higher Education IT professionals between November 2019 and January 2020. As with the v.9 Benchmarking report, some of the questions have been updated to reflect the changing nature of the service desk industry and provide an insight into current issues and trends.
1.0 Background and Demographics
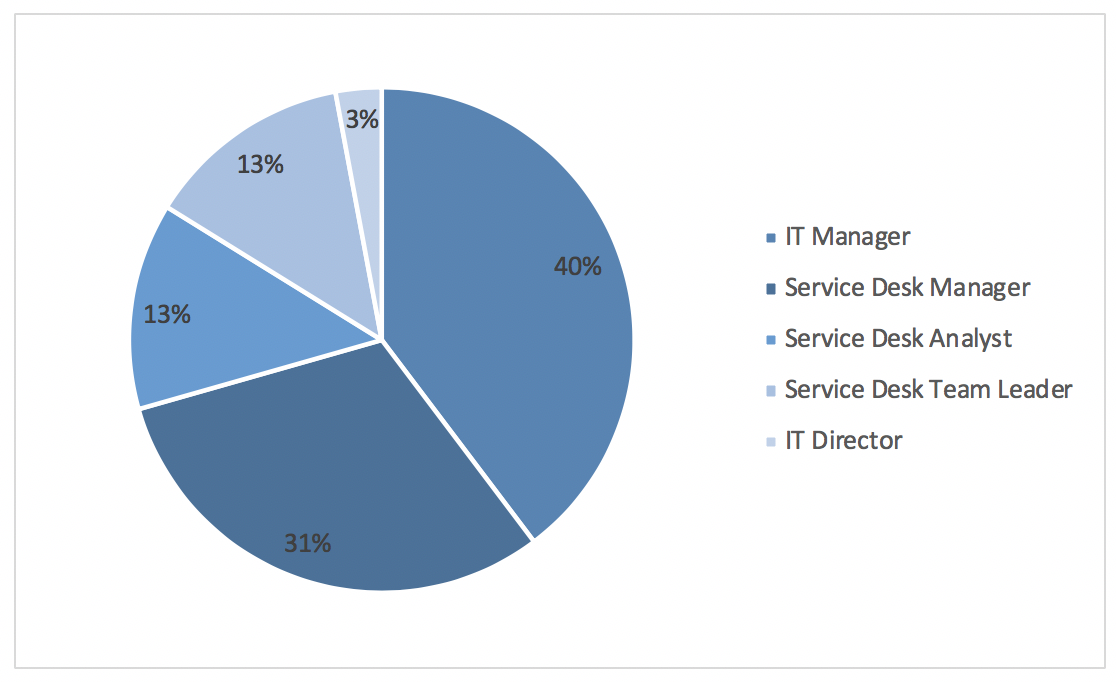
1.1 Job Titles
Which of the following best describes your job role?
1.2 Services
Which of the following services do you provide support for?
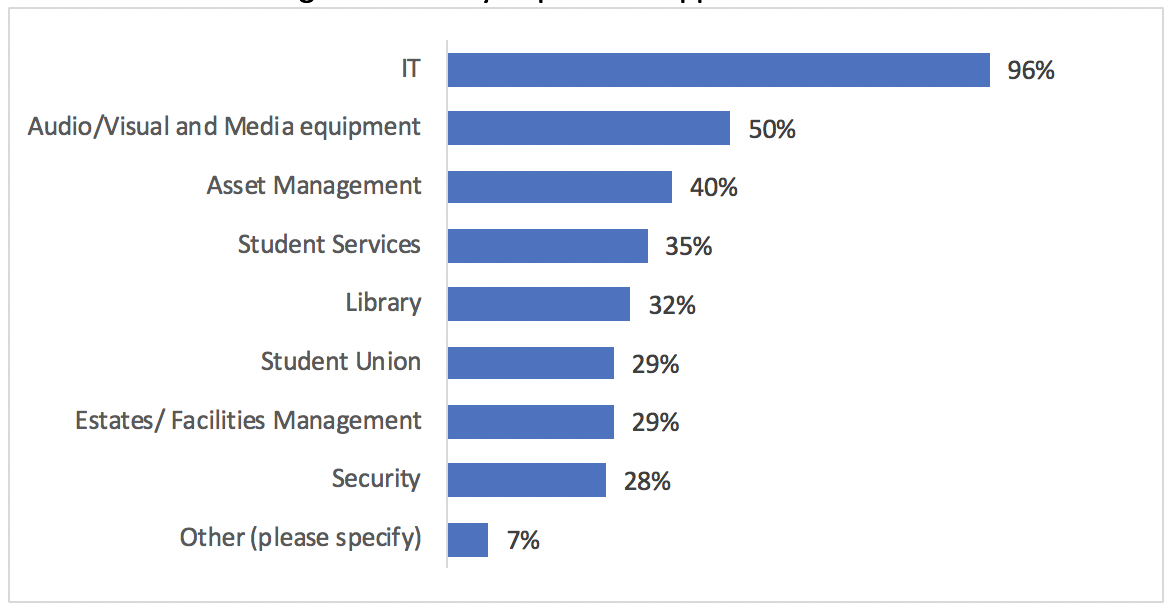
When compared to the previous report, the range of services offered by service desks has remained roughly the same, with some small movement. Predictably, service desks most commonly provide IT services, followed by Audio/Visual media equipment support.
2.0 Headcount
2.1 Average Headcount
Please provide the average number of staff employed for the following sections:
|
Number of staff on the service desk |
12 |
|
Number of staff in a customer facing role (e.g. first line with direct contact with customers) |
16 |
|
Number of support staff (e.g. second and third line) |
50 |
|
Number of management/ supervisory staff |
9 |
In comparison to the v.9 Benchmarking report, higher education support team headcounts are generally slightly lower than average. However, in comparison to the 2016 Higher Education report, staffing levels show a slight increase, signifying growth within the industry.
2.2 Projection
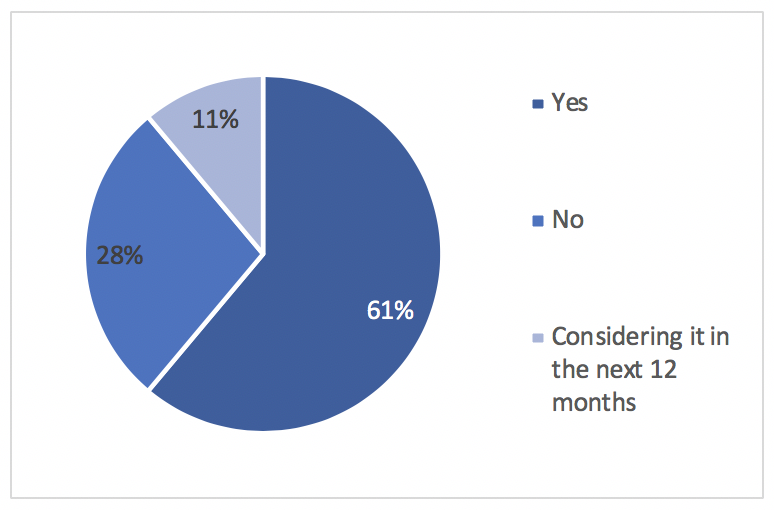
Do you expect your staffing levels to:
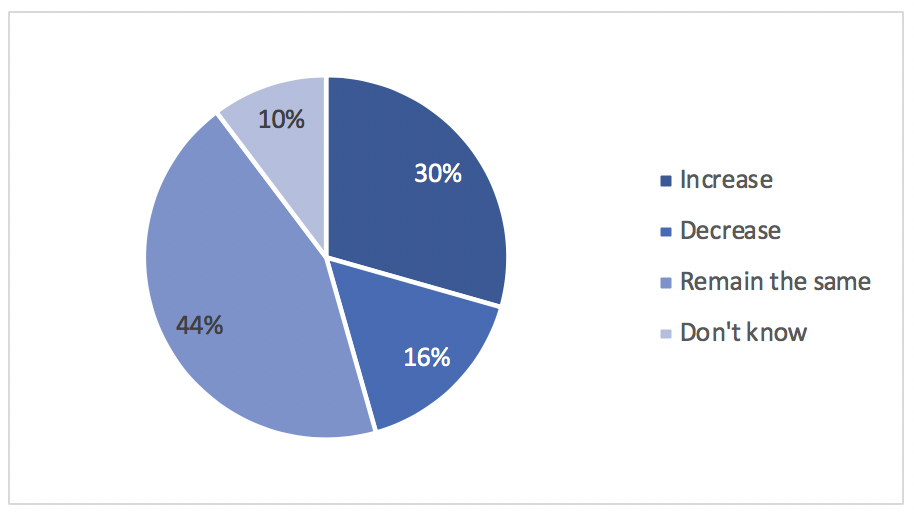
One important reason to ask this question is due to the perception that technological advances could lead to job losses, particularly for lower level staff. Generally, the majority of higher education service desk customers will be younger generations and digital natives, therefore they may be more inclined to use alternative support channels than service desk customers in a different industry. This presents some questions in terms of whether the number of service desk staff, particularly first line, is needed. As technology continues to develop, the need for a human first line may need to be justified more frequently, therefore it is important to understand how service desk professionals expect to see their staffing levels change in the future.
The largest proportion of respondents indicate that they expect their staffing levels to remain the same, which is lower than in 2016. As a result, the proportion of respondents in the remaining three segments is higher: 30% believe their staffing level will increase, 16% expect a decrease, and 10% are not sure. This is more in line with the v.9 Benchmarking report, with some slight movement.
3.0 Staff
3.1 Incentives
Which of the following incentives do you offer to your service desk team (over and above the university policy on reward and recognition)?
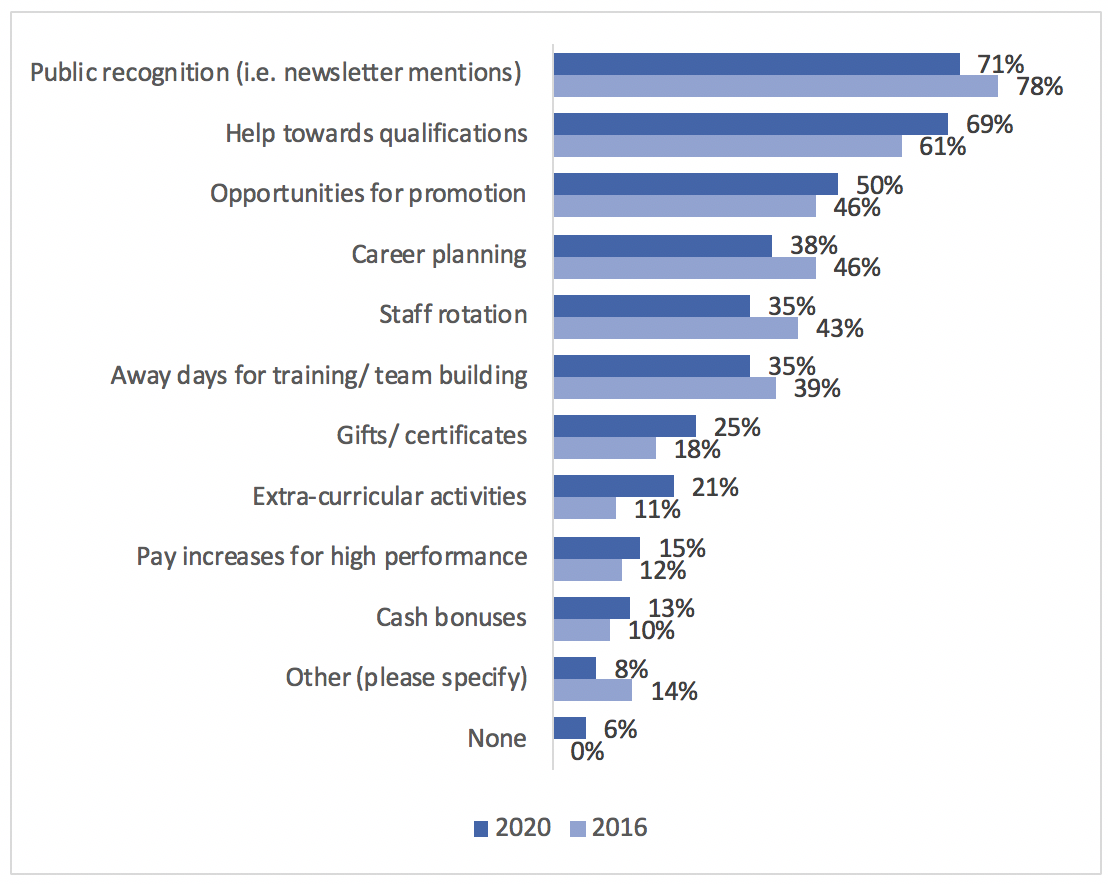
Generally, the types of incentives offered to staff have remained roughly the same as they were in 2016, though this is quite different to the v.9 Benchmarking report. In particular, public recognition plays a much more important role in higher education staff incentives than in the wider service desk industry.
3.2 Employee Satisfaction Surveys
Do you carry out employee morale surveys that are specific to the service desk?
In comparison to the 2016 report, the proportion of higher education service desks which carry out employee morale surveys has halved. This follows the trend we saw in the v.9 Benchmarking report, which also saw a fall in the proportion of service desks carrying out staff morale surveys, though the above statistic is lower than its wider industry counterpart.
This is certainly a surprising development, as the 2016 report showed much higher numbers. Employee satisfaction can have a direct impact on service desk performance, among other factors, and failing to monitor your employee satisfaction could lead to a number of issues for the service desk and the wider university.
3.3 Induction Training
How many hours of formal induction training do new service desk analysts receive?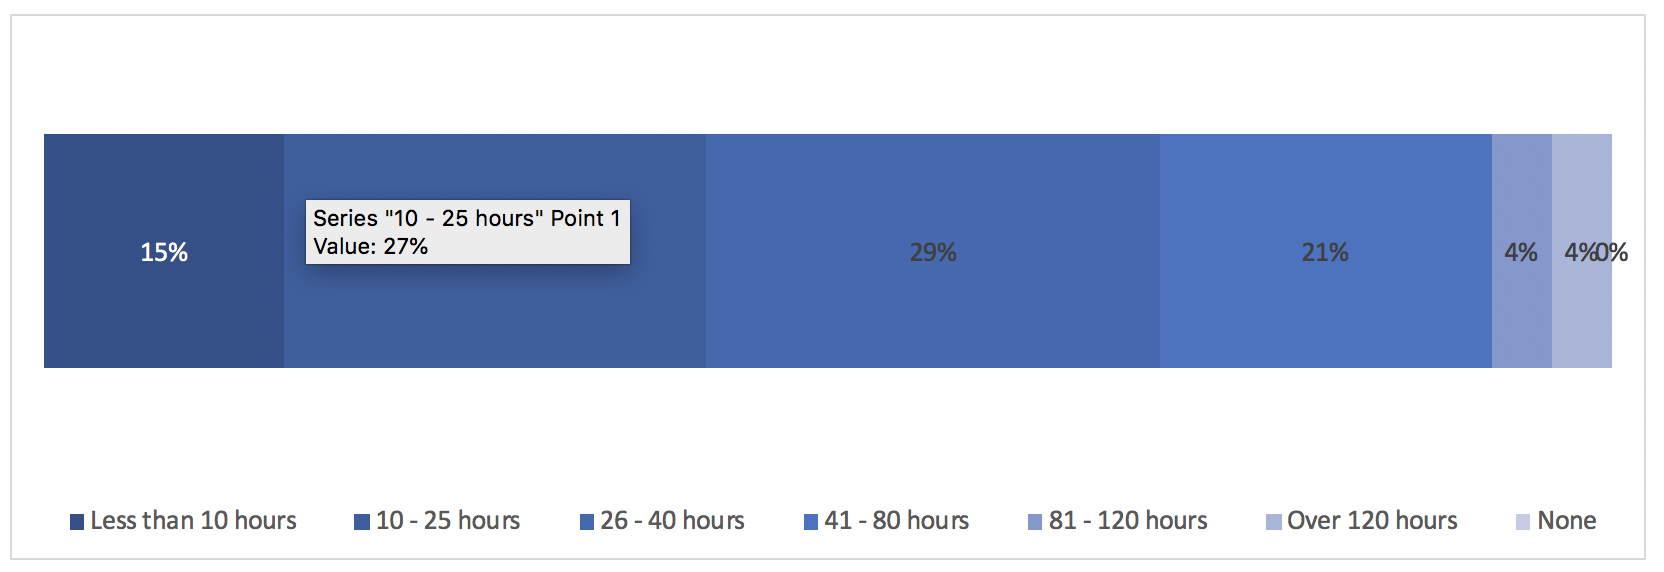
The v.9 Benchmarking survey showed an increase in the average number of hours of training service desk analysts receive. The above statistic shows a similar outcome; in fact, the higher education industry seems to provide their analysts with more hours of training on average, with the largest proportion of respondents specifying they provide 26 to 40 hours of induction training. The largest proportion in the wider industry report indicated they provide 10 to 25 hours.
3.4 Composition of Training
What type of formal induction training, if any, is given to new service desk analysts?
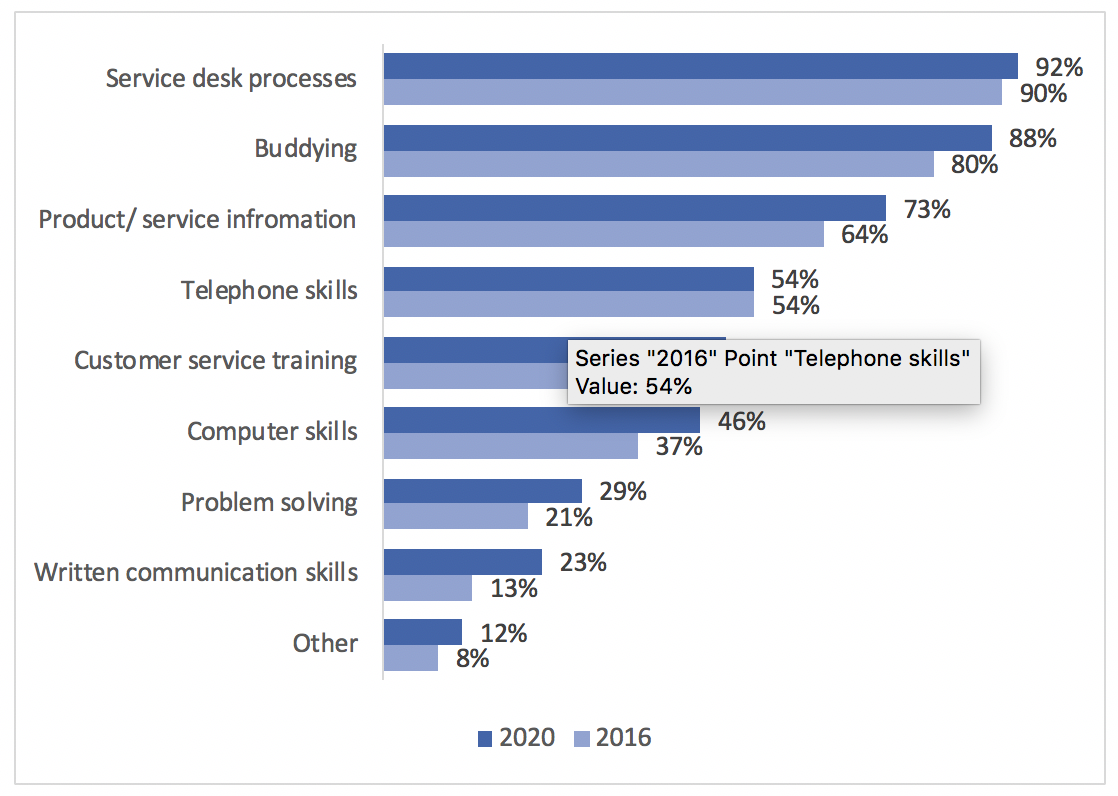
Since 2016, there has been little movement in the types of training service desk analysts receive. This could be considered slightly worrisome, as it could signify that the higher education industry has not developed over time to account for changes in the industry surrounding people, process, or technology. There are some differences in comparison to the wider industry report, though “service desk processes” is the most popular type of training among both cohorts.
In the wider industry report, we mentioned the need to fill the digital skills gaps and to ensure staff’s skills are able to support the growing digital needs of the business. We have previously mentioned that a significant proportion of higher education service desk customers are of a younger generation, therefore their digital needs may change faster than a traditional organisation’s staff would. Therefore, if service desk analysts’ training does not change to suit the growing needs of the customer base, this may have a negative impact on things like resolution times, escalation rates, and customer experience.
3.5 Staff Retention
What is the average time, in role, of your service desk analysts?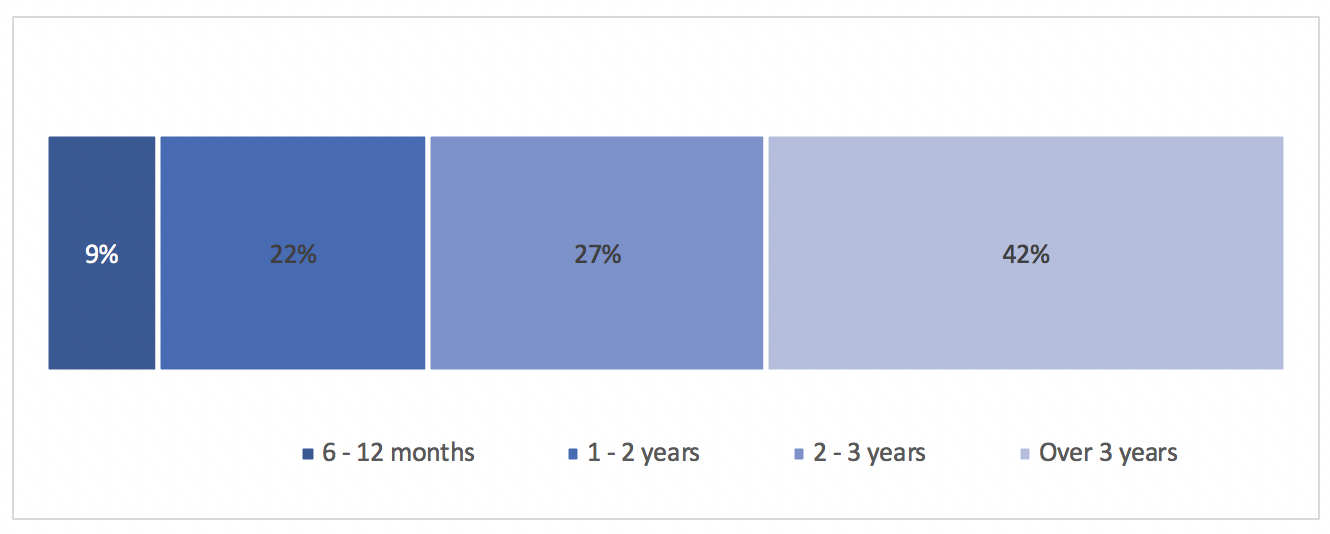
Here we can see that 42% of respondents highlighted that their analysts spend over three years on the service desk. Again, this is a similar statistic to the v.9 Benchmarking report, suggesting an overall trend rather than a shift within the higher education industry. It is difficult to ascertain the reason for this shift without analysing where analysts go when they leave the service desk, which we will see in the next question.
3.6 Service Desk Leavers
When people on permanent contracts leave the service desk where do they go?
We can see that the majority of respondents specified that analysts move on to other IT roles within the university, with 80% remaining in the university in some capacity. This shows a significant difference from the v.9 Benchmarking report, where only 60% of respondents highlighted that analysts remain within the organisation, with 44% moving to other IT roles.
In the v.9 Benchmarking report, we theorised that a combination of evolving technologies requiring organisations to upskill their staff and offer them promotions could explain the increased longevity of service desk staff. However, given that the type of training offered has not changed much since 2016, and promotion opportunities and pay increases in terms of incentives are not as common in the higher education industry, perhaps there are different motivations for service desk staff to stay within the university.
3.7 Student Internships
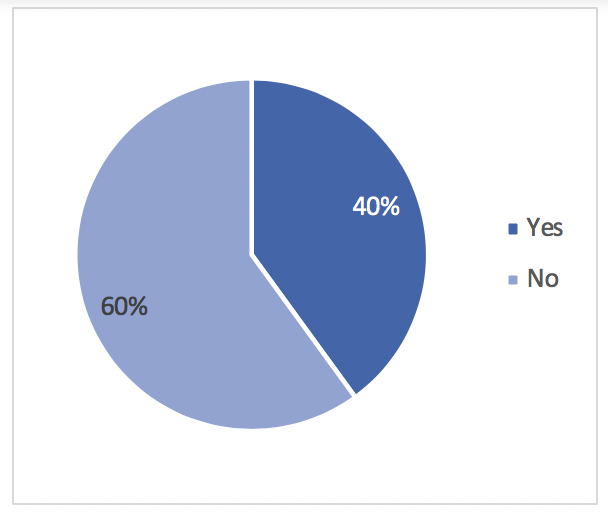
Do you recruit students to work on the service desk or offer an internship scheme?
Since 2016, the proportion of higher education service desks which recruit students or offer internships has increased by nearly 20%. Introducing what are essentially service desk customers into the support team can have incredible benefits, especially in terms of service improvement initiatives, as students or interns may have a good insight into the service and understand what could be done to improve it. Therefore, it is promising to see a significant proportion of respondents recognising the value of this resource.
4.0 Salaries
4.1 Starting Salaries and Pay Rises
What are the average starting salaries of:
|
Higher Ed |
v.9 Benchmarking |
|
|
Service Desk Analysts |
£22,630 |
£20,900 |
|
Service Desk Team Leaders/Supervisors |
£29,536 |
£27,080 |
|
Service Desk Managers |
£37,681 |
£38,265 |
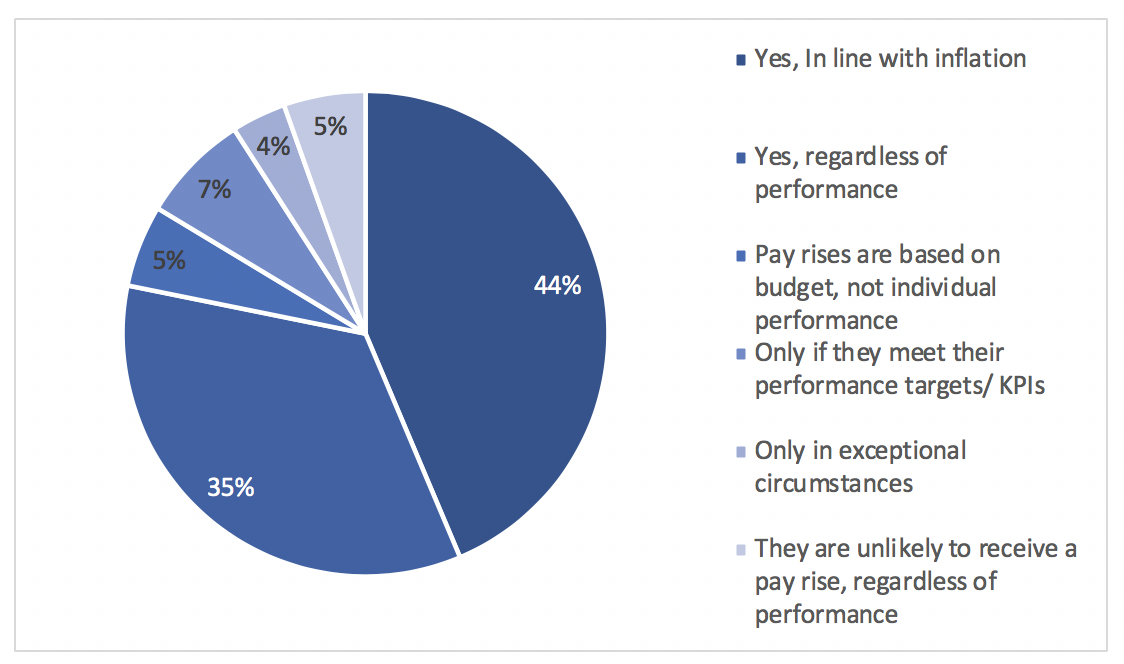
Will staff receive a pay rise within two years?
Interestingly, salaries within the higher education service desk industry are higher than the wider industry average for analysts and team leaders. However, on average, higher education service desk managers will earn less than they might in a different industry, though the difference is minimal.
Similar to the v.9 Benchmarking report, the majority of respondents identified that service desk staff will receive a pay rise after two years in line with inflation. However, the next largest proportion stated that higher education service desk staff will receive a pay rise regardless of performance, whereas the wider industry staff can only expect a pay rise if they meet their targets.
Perhaps the longevity of service desk staff is linked to the higher-than-average remuneration, though there may be other factors linked to this which are not surveyed in the report.
5.0 Qualifications
5.1 Training Plans
What qualifications are you, or your staff, due to take over the next 12 months?
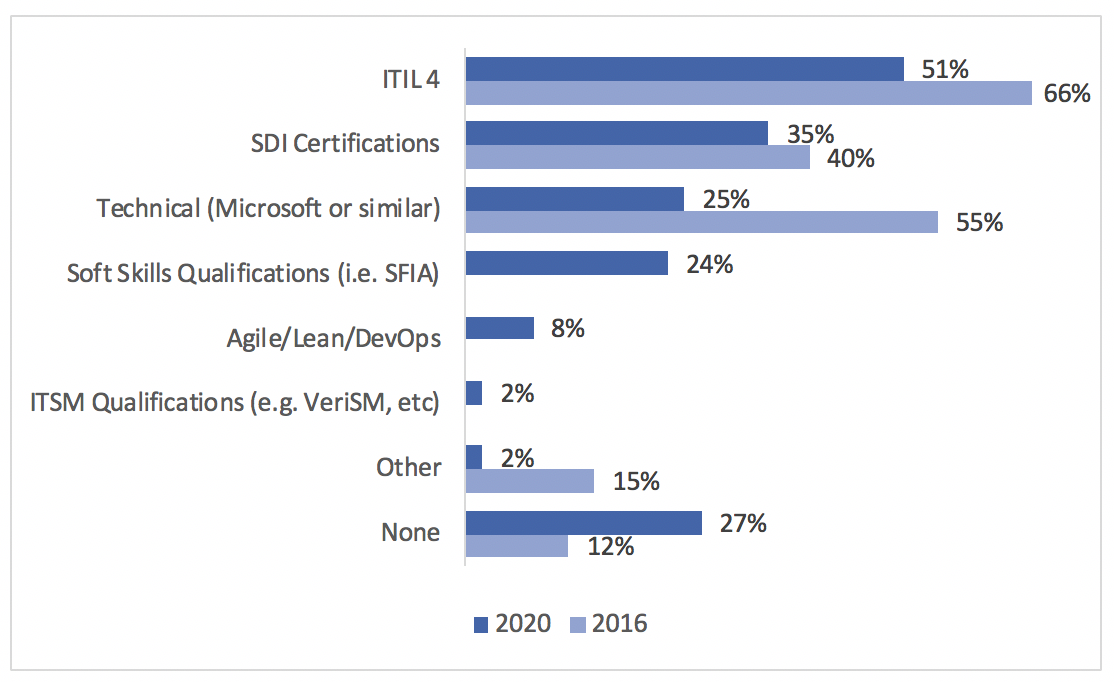
ITIL remains the most popular qualification for service desk professionals working in higher education; a similar trend can be seen in the wider industry report. However, both this report and the wider industry report show that a smaller proportion of service desks plan to take the newer ITIL4 qualification than had previously planned to take ITIL v3 training, despite the latter being several years old. As ITIL 4 will be updated regularly, perhaps some professionals are waiting for further iterations before looking to gain the qualification.
Other notable changes can be seen in the fact that over half of the amount of service desk professionals plan to undertake a technical qualification, which is interesting. Perhaps this is due to the idea that as an industry, we are moving towards having a more customer-focused service which requires “soft skills” over technical skills. This could be supported by the similar proportions of respondents planning to undertake soft skills qualifications vs. technical qualifications. Alternatively, as we have offered more options this year and the proportion of respondents is spread out, the number of professionals who are due to take technical qualifications has not necessarily been affected, but the relative proportion in this question has.
A surprisingly large proportion of respondents identified that they do not plan to undertake any professional qualifications over the next year. We have already mentioned that upskilling is an important consideration for service desk staff, as developing alongside technology can help improve IT services whilst also reducing the risk of redundancy and low employee morale. Therefore, this statistic is rather worrisome. Not only has it increased since 2016, but also because this could have negative impacts on headcount in the near future.
5.2 Frameworks and Standards
Which of the following best practice standards or frameworks have you adopted?
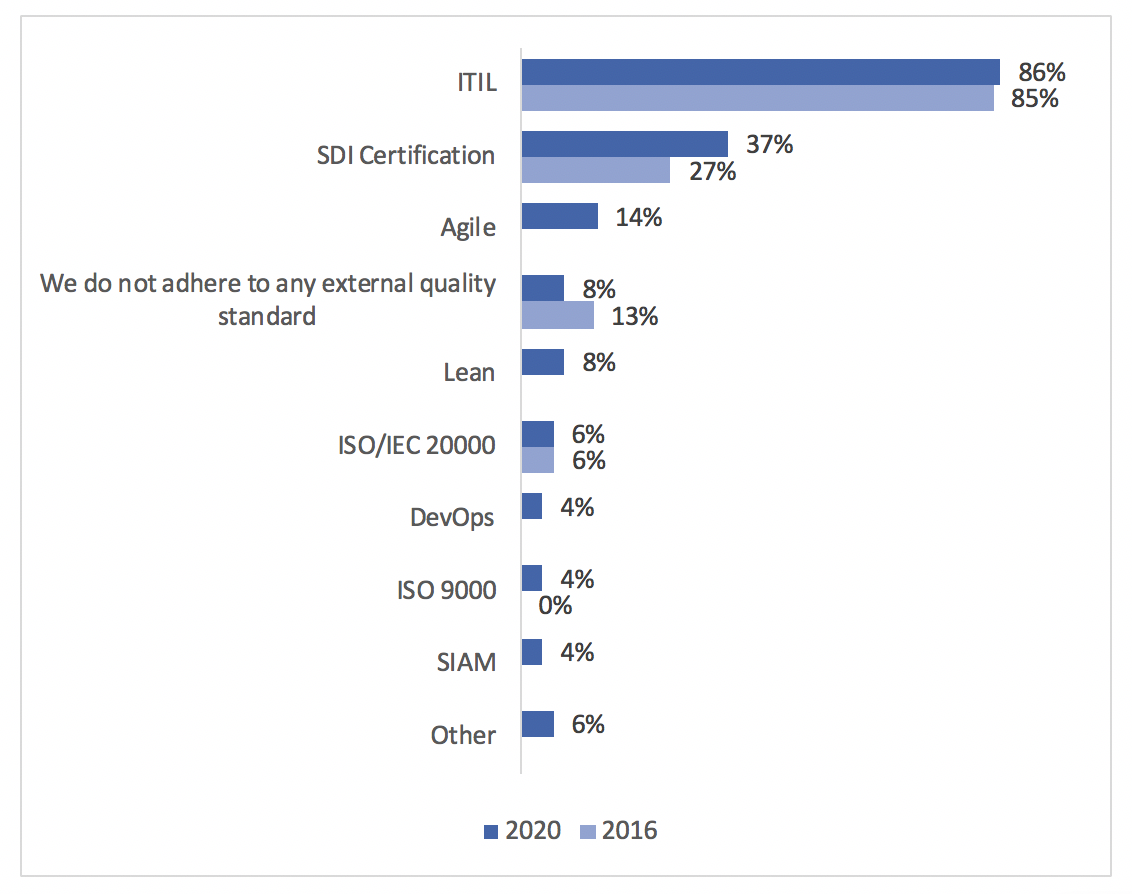
As with the previous question, several options were added to this question to reflect the changes in the industry. Again, we can see that ITIL best practice adoption remains the highest, which is consistent with the 2016 report and the v.9 Benchmarking report. SDI certification has increased in adoption by 10% since 2016, and this is also a higher proportion than in the v.9 Benchmarking report, which is certainly a positive sign. Generally, adoption of other frameworks is lower than the wider industry, suggesting that the higher education industry is less likely to adopt newer ways of working than perhaps some other industries.
6.0 Customers Satisfaction
6.1 Measuring Customer Satisfaction
How do you measure customer satisfaction?
What do you do with this information once it is collected?
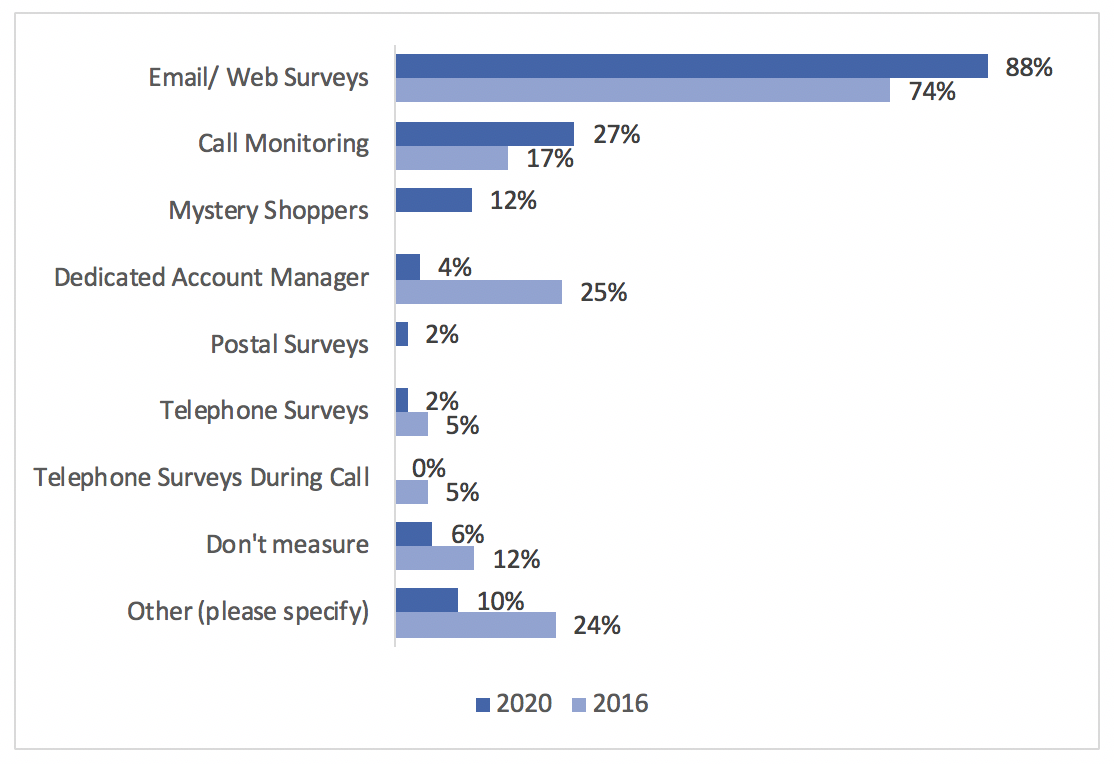
Gathering customer feedback is an important step in understanding your customers’ satisfaction and experience with your service. It appears that since 2016, we can see an increased use of email or web survey, call monitoring, and mystery shoppers, as well as a decrease in the proportion of respondents who do not measure customer satisfaction. This is lower than the wider industry average, which is a positive finding.
We can see that once the information is collected, the majority of respondents feed it into a service improvement plan, 29% go through informal escalation, and 2% adhere to ISO/IEC 9000 procedures. Unfortunately, 4% specified they do nothing. These service desks may be missing out on potentially valuable service improvement feedback from their customers.
6.2 Measuring Success
What is the main indicator of success for your service desk?
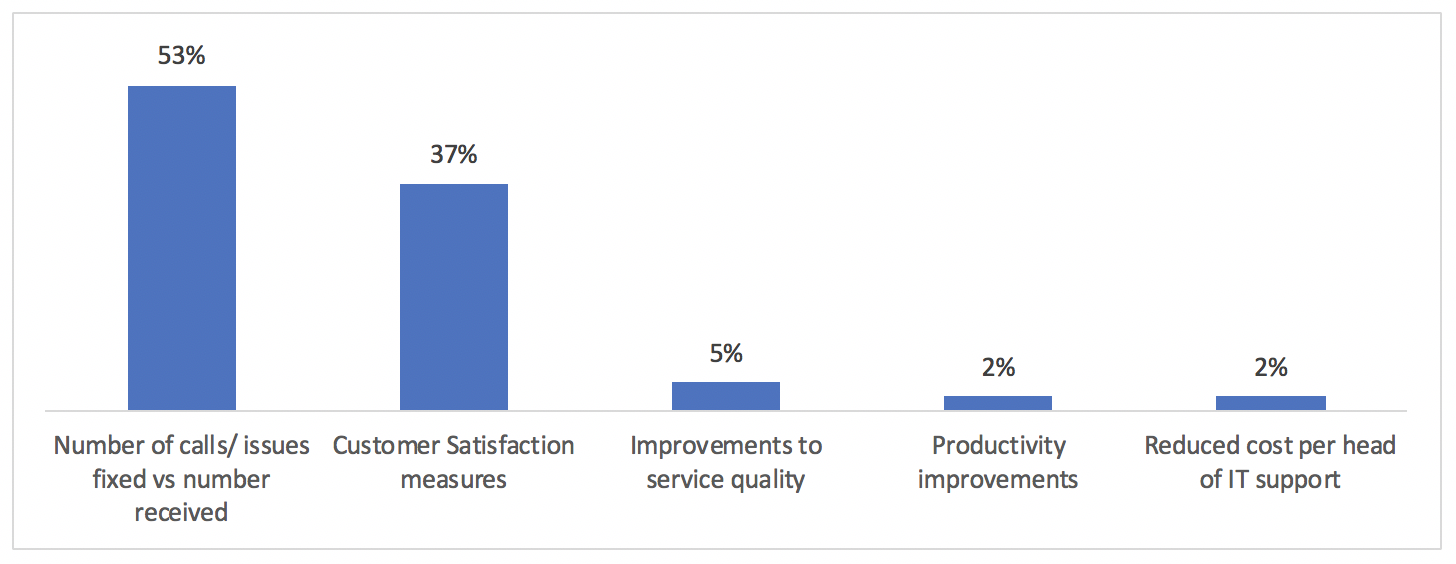
We can see that over half of respondents highlighted that the volume of tickets resolved is the main indicator of success for their higher education service desk, with a smaller but still sizable proportion stating their success measure is customer satisfaction. In comparison to the wider industry report, it appears that the higher education industry favours ticket resolution as an indicator of success than perhaps some other industries which favour customer satisfaction measures
The remaining factors, similar to the wider industry report, are considered main success indicators by much smaller proportions of respondents in favour of ticket resolution and customer satisfaction.
7.0 Service Desk Tools and Technologies
7.1 Tools and Technologies
Which of the following technologies do you currently have access to?
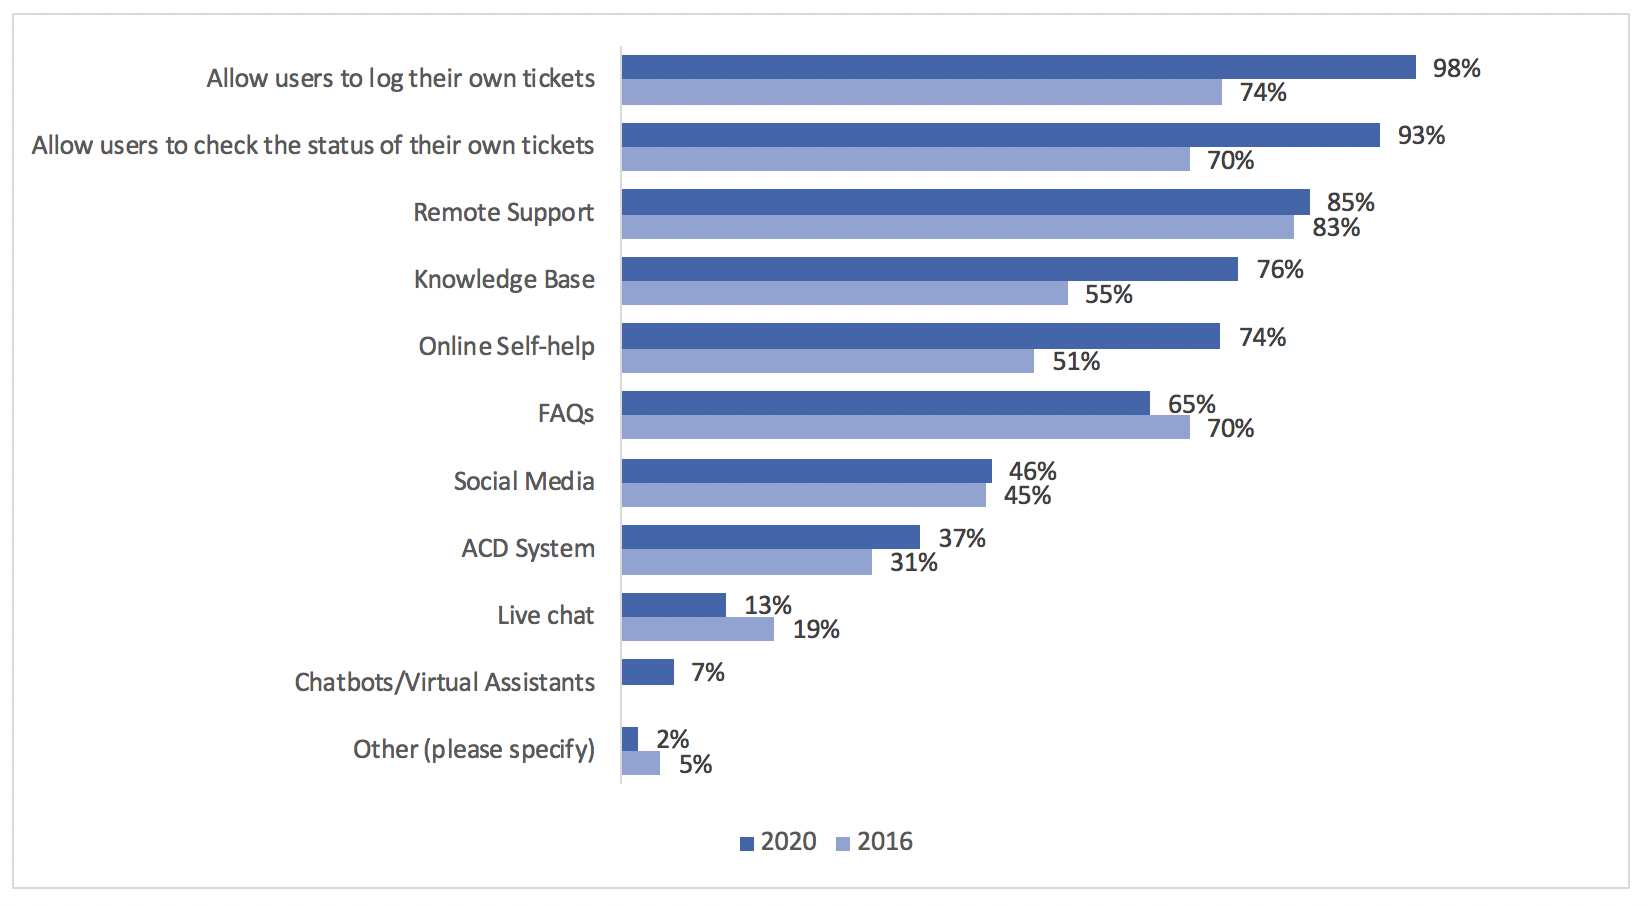 Immediately, we can see that the proportion of higher education service desks offering self-service has risen. Many tool vendors will have a product specifically for higher education service desks, which could potentially make the implementation and development of a self-service portal easier and can contribute to channel adoption.
There has also been an increased use of knowledge bases and self-help among higher education service desks. A well-structured and thorough knowledge base can be a good basis for AI-enabled technologies. For example, integrating a knowledge base with alternative support channels, such as chatbots and automation, can create seamless workflows to facilitate a zero-touch service, better customer experiences, and a more self-service customer base.
Interestingly, the proportion of higher education service desks providing live chat has fallen slightly, though the proportion which offer chatbots and virtual agents is higher than the wider industry average. Perhaps service desks which had previously used live chat were able to easily migrate the channel to a chatbot as a proportion of customers would have been familiar with using this communication platform.
7.2 Contact Methods
What methods do your customers employ to contact your service desk?
As expected, telephony is still the most popular communication method for higher education service desk customers, and this is in keeping with the wider industry report. Interestingly, however, since 2016 we can see that self-service adoption has risen by nearly 40%. This, again, is similar to the jump we saw in the v.9 Benchmarking report. This development is somewhat expected, as self-service has matured significantly since 2016, and has become much more accessible for organisations of all industries and sizes. Furthermore, we have previously mentioned that a significant proportion of higher education customers are students, are generally younger, and grew up with newer technology and may feel more comfortable using a self-service portal. Along with society being generally more technologically adept, the growing culture of Shift Left, and technologies like self-service being used more frequently in the consumer space, these factors could be contributing to the increase in self-service adoption.
Having said this, we can also see that in-person contacts have increased by about 10% since 2016, which is contrary to the wider industry report. Furthermore, according to the data, in person is a much more popular contact method for higher education service desks than perhaps some other industries. Perhaps the potentially lower wait times and faster resolution is more appealing for certain issues, such as issues with connecting a device to the internet, or perhaps students may not be aware of the alternative options.
As we saw in the previous graph, a greater number of higher education service desks offer a chatbot communication channel, while fewer offer live chat, and this correlates with the proportions of higher education customers using chatbots and those not using live chat.
What percentage of your calls are received through the following channels?
|
2020 |
2016 |
|
|
Telephone |
38% |
35% |
|
|
37% |
43% |
|
Self-Service |
19% |
16% |
|
In person |
15% |
14% |
|
Social Media |
8% |
1% |
|
Live Chat |
6% |
1% |
|
Other |
6% |
0% |
Despite self-service being offered by a higher proportion of service desks and a larger proportion of service desk customers using the channel, the usage rate has not dramatically increased. However, social media and live chat usage rate has increased despite fewer respondents identifying that their customers use these channels. There could be several factors that play into this: firstly, it depends on the channels that each individual service desk offers, the capabilities of the different channels, the experience of the channels, etc.
Telephony has increased slightly in usage in comparison to 2016; however, this percentage is lower than the wider industry report, whereas email uptake in the higher education industry has fallen but is still higher than in the wider industry.
7.3 Bring Your Own Device
Which best describes your Bring Your Own Device (BYOD) support?
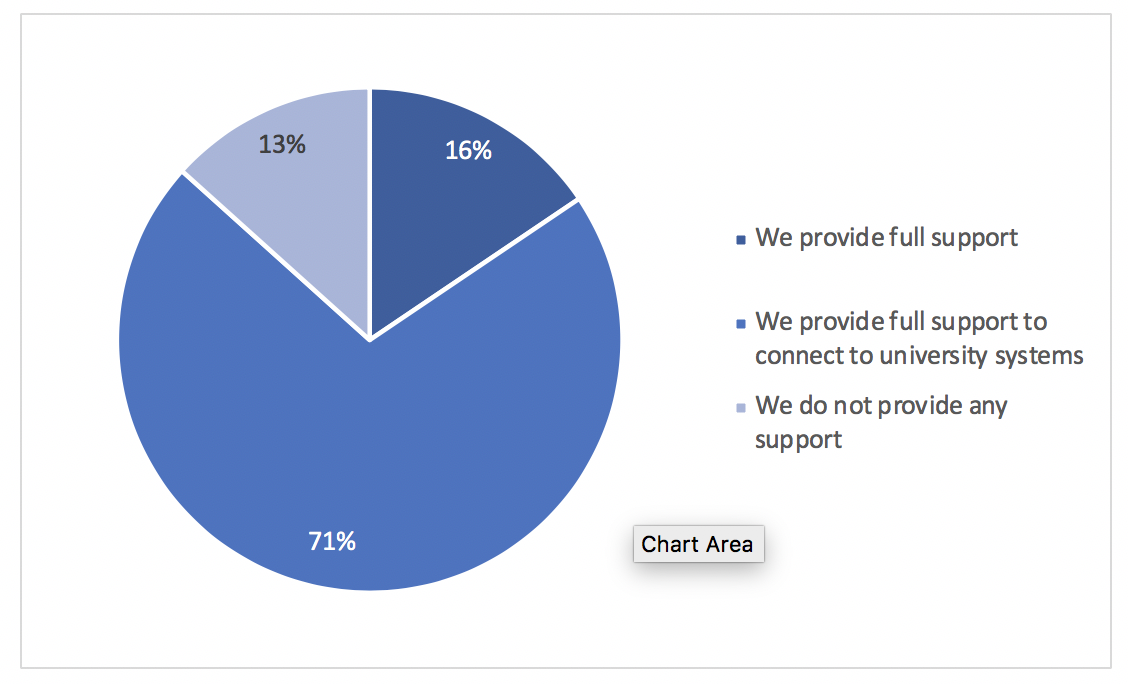
Compared to the v.9 Benchmarking report, a much larger proportion of higher education service desks provide BYOD, though this is a slightly smaller proportion than the 2016 report. BYOD is an important offering within a university, as a large new batch of “customers”, or students, arrive every year with different technology requirements. For example, if a student uses their own laptop to work and study, they may need to be able to connect to the campus WiFi or other university systems. It appears that 71% of respondents offer this type of support. However, a much smaller percentage would offer technical support for an individual’s personal device if, for example, there was an issue preventing the device from functioning properly.
8.0 Productivity
8.1 SLAs and XLAs
Do you have any of the following formal written agreements with your customers?
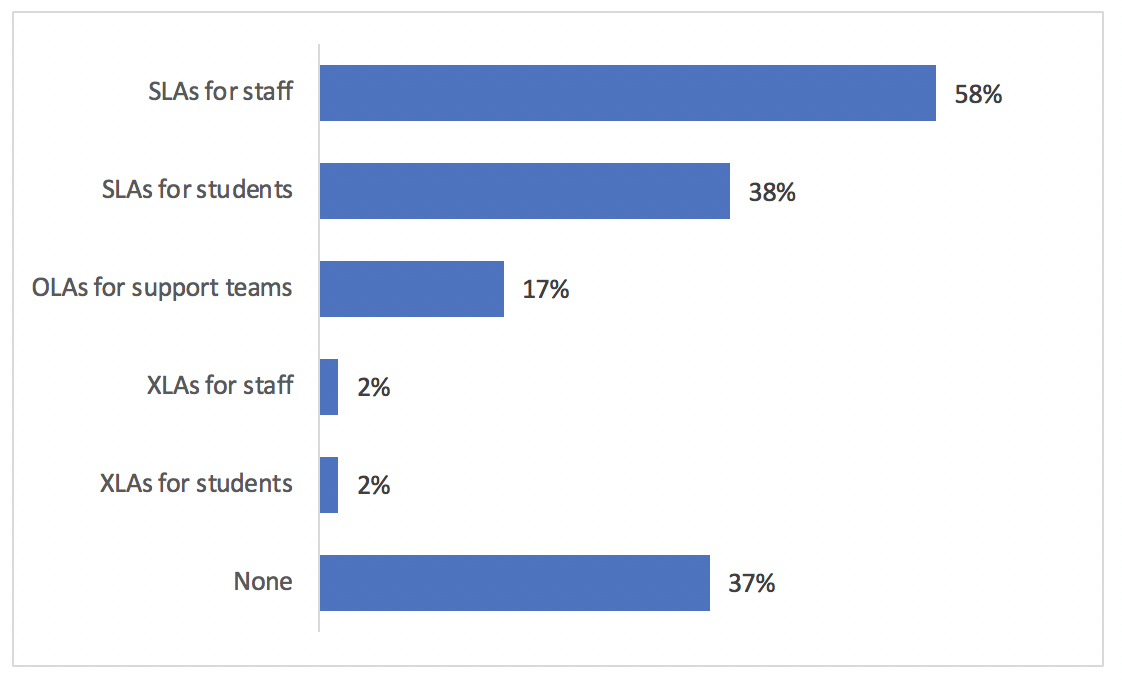
In 2016, 70% of higher education service desks did not have an SLA, 26% had an SLA for staff, and 4% had them for students. While a significant proportion of respondents still do not have an SLA, this is almost half the 2016 statistic. In comparison to the wider industry, 16% of service desks have neither SLAs nor XLAs, showing that a higher proportion of higher education service desks do not have service agreements with their customers.
Often, setting service level expectations can help to manage and improve the customer experience; therefore, it is positive to see a higher proportion of higher education service desks adopting either SLAs or XLAs for their customers. However, according to the data, a higher proportion of respondents have SLAs for staff rather than students.
8.2 Measuring Productivity
It should be stressed that these figures should not be considered to equate to any kind of industry standard and are for interest only. Such standards can be misleading as they do not reflect variations in the industry and differences in types of support. Also, calculations are not always based upon equivalent criteria, which can make comparative analysis misleading.
As with the wider industry report, we have changed how we collect this data from exact figures to grouped options. This is for several reasons. Firstly, it is to accurately portray the service desk industry in terms of their performance and how diverse industry “averages” can be. Secondly, different service desks may measure their metrics in different ways, and this method regulated the unit of measurement, making analysis and presenting the data easier and more accurate. The percentages against the numerical options are relative to the proportion of respondents who identified that they measure the performance metric, whereas the “Don’t measure” or “Don’t use...” options are a proportion of all respondents. For the purpose of comparison, we will only compare the following statistics with their counterparts in the wider industry report. The questions and options differ from the 2016 report and therefore do not lend themselves to direct comparison.
If you measure it, what is the average speed to answer?
|
2020 |
Wider Industry |
|
|
<10 seconds |
21% |
20% |
|
10-30 seconds |
31% |
41% |
|
31-60 seconds |
41% |
17% |
|
>60 seconds |
7% |
22% |
|
Don't measure |
28% |
30% |
It appears that on average, higher education service desks take longer to answer a call. The proportion of higher education service desks has also risen from 19% in 2016 to 28%.
If you measure it, what is the average abandon rate?
|
2020 |
Wider Industry |
|
|
<5% |
41% |
58% |
|
5-10% |
38% |
37% |
|
>10% |
21% |
5% |
|
Don't measure |
28% |
36% |
Interestingly, the average abandon rate for higher education service desks is higher than the wider industry, though a larger proportion measure it.
If you measure it, what is the average first-contact resolution rate?
|
2020 |
Wider Industry |
|
|
<20% |
7% |
4% |
|
20-40% |
24% |
8% |
|
41-60% |
28% |
35% |
|
61-80% |
34% |
33% |
|
>80% |
7% |
29% |
|
Don't measure |
26% |
17% |
The data shows that on average, the higher education industry’s first-contact resolution rate is lower than that of the wider industry, and fewer respondents identified that they measure it.
If you measure it, what is the average number of incidents logged on a monthly basis?
|
2020 |
Wider Industry |
|
|
<500 |
7% |
19% |
|
500-1000 |
10% |
19% |
|
1001-2500 |
34% |
23% |
|
2501-4000 |
17% |
11% |
|
4001-5500 |
15% |
6% |
|
5501-7000 |
2% |
6% |
|
>7000 |
12% |
17% |
|
Do not measure |
5% |
10% |
It would appear that on average, higher education service desks log more incidents per month than the wider industry, and fewer higher education service desks do not measure this metric.
If you measure it, what is the average percentage of incidents escalated to second-line on your service desk?
|
2020 |
Wider Industry |
|
|
<5% |
3% |
0% |
|
5-10% |
21% |
26% |
|
11-20% |
38% |
46% |
|
>20% |
38% |
28% |
|
Don't measure |
26% |
21% |
The data shows that the higher education industry is somewhat similar to the wider industry average in terms of escalation rates, if not slightly higher. Roughly the same proportion measure this metric.
If you measure it, what is the average number of service requests logged on a monthly basis?
|
2020 |
Wider Industry |
|
|
<500 |
6% |
18% |
|
500-1000 |
26% |
18% |
|
1001-2500 |
37% |
37% |
|
2501-5000 |
20% |
24% |
|
>5000 |
11% |
12% |
|
Don't measure |
13% |
16% |
We can see that the higher education industry receives on average more service requests per month than the wider industry, though this is not a huge difference.
If you measure it, what is the average percentage of tickets that are deflected by self-service on a monthly basis?
|
2020 |
Wider Industry |
|
|
<5% |
50% |
26% |
|
5-10% |
11% |
26% |
|
11-20% |
28% |
22% |
|
>20% |
11% |
26% |
|
Don't measure |
45% |
47% |
|
Don't use self-service |
8% |
12% |
Whereas within the wider industry, self-service deflection is relatively evenly spread. The higher education industry averages a lower deflection rate. A similar proportion do not measure this metric.
If you measure it, what is your average CSAT score?
|
2020 |
|
|
<40% |
0% |
|
40-60% |
9% |
|
61-80% |
9% |
|
81-95% |
59% |
|
>95% |
23% |
|
Don't Measure |
42% |
This metric was not surveyed in the v.9 Benchmarking report. However, we can see that the higher education industry seems to perform well in terms of customer satisfaction, with 82% of the respondents who measure this metric averaging over 81%. However, over 40% of respondents specified they do not measure this metric, which is much larger than the statistic we saw earlier. This could be due to the fact that a number of respondents measure their CSAT in a different method, such as Net Promoter Score.
9.0 The Future
9.1 Industry Thoughts
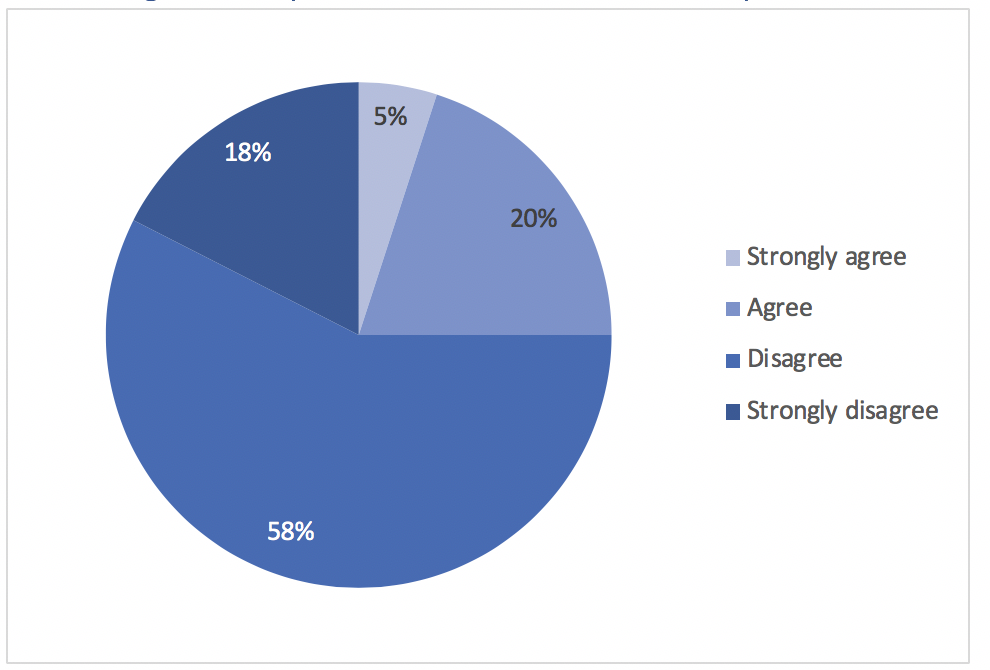
In the future we will use more self-help and self-service facilities.
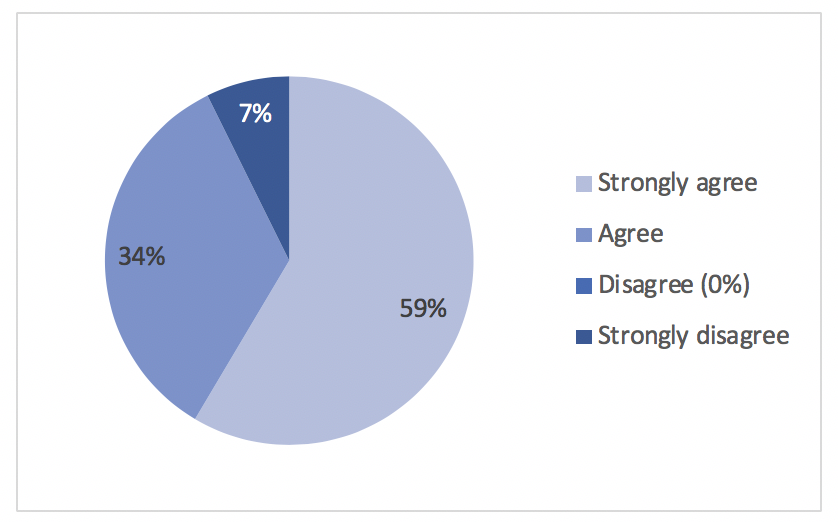
We can see that the vast majority of higher education service desk professionals believe that they will continue to use more self-service and self-help facilities in the future. AI-enabled technologies are enabling IT organisations to mature their self-service capabilities; therefore, it is promising to see respondents identifying that the future service desk could facilitate a more self-serving customer base.
No respondents disagreed with this statement, however 7% did strongly disagree. There could be a number of reasons for this: perhaps their higher education service desk is not succeeding with self-service, and therefore they are pursuing other support channels, or perhaps they believe self-service will be superseded by a more advanced channel, such as a chatbot or virtual agent.
In the future, we will use more Chatbot and Virtual Agent.
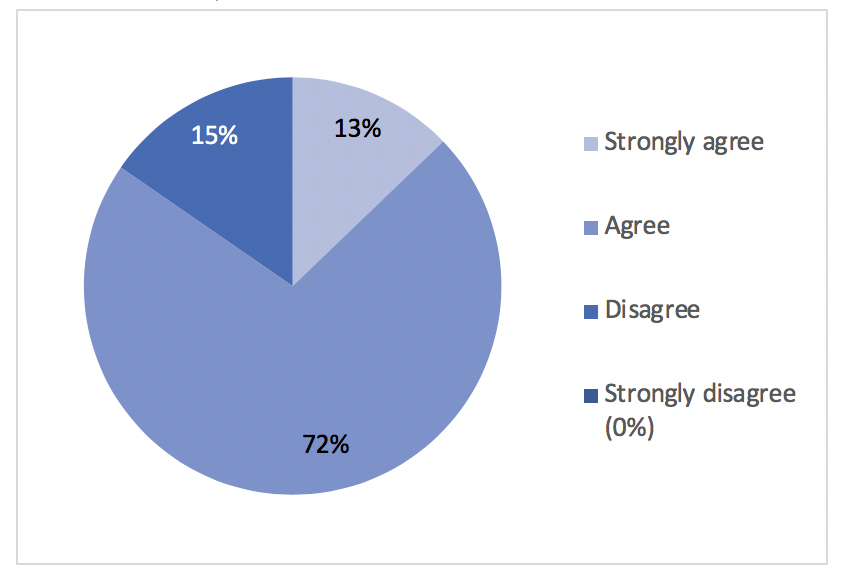
While a significant proportion of respondents agree that they will use more chatbot and virtual agent technologies in the future, they are less certain than they were responding to the previous statement, with only 13% strongly agreeing. Further analysis of the data showed that around 60% of respondents who strongly disagreed with the previous statement agreed with this one, support the argument that a proportion of professionals believe that self-service will be superseded.
In comparison to the wider industry, higher education service desk professionals seem generally more accepting towards chatbots and virtual agents, with only 65% of the wider industry agreeing with this statement.
We use less than half of all the functions of our service desk system software
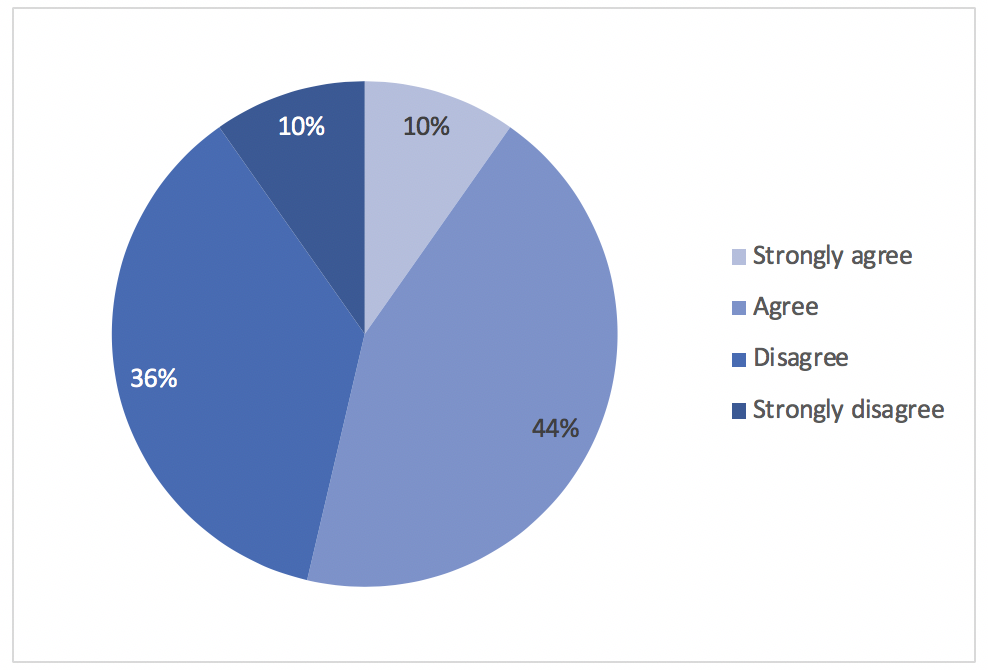
Respondents appear to be fairly evenly split between agreeing and disagreeing with this statement, which mirrors the sentiments of the wider industry. ITSM tools may offer functionalities which are not relevant to your organisation’s needs, therefore reducing the ROI of the tool. In order to unlock the full ROI potential of your ITSM tool, you should discuss your needs with potential vendors during the procurement phase and work closely with your chosen vendor’s implementation team to ensure you are fully utilising your tool’s capabilities.
Knowledge base systems are too difficult to implement and maintain on our service desk
Again, higher education service desks mirror the sentiments of the wider industry in relation to this statement. We have previously seen that knowledge bases have become more popular among higher education service desks; therefore, it is promising to see the majority of respondents disagreeing with this statement.
Conclusion
This report provides valuable insight into the health and maturity of the higher education service desk industry. For the most part, there has been a level of stability and consistency since 2016, as well as consistencies with the wider industry report. However, there are some notable changes. It is important to understand the nuances of different industries and the factors which makes them unique. The higher education industry, for example, will need different tool capabilities than a service desk in the finance sector.
Traditional communication methods are still popular among higher education industry, with in-person support actually increasing in uptake. However, the proportion of higher education service desks offering self-service and self-help has also risen, suggesting that they are providing support channels which suit numerous customer profiles, ensuring a better, more convenient customer experience.
Furthermore, a larger proportion of the higher education industry offer chatbots or virtual agents as a communication channel in comparison to the wider industry, and a larger proportion expect usage of these technologies to increase in the future. This suggests that higher education service desk professionals have a good grasp on the needs and preferences of their customers.
Having said this, customer experience is arguably not the most important consideration for a proportion of higher education service desks, as a larger number of respondents identified the volume of ticket resolutions as a more significant indicator of success. On the other hand, soft skills training, such as customer service, is as popular as technical qualifications, according to our data.
Another important note is that in comparison to 2016 and the wider industry, higher education service desk analysts stay in their role on average for a much longer period of time, and a higher proportion remain within the university when they leave. Perhaps this is due to the fact that the average salaries for analysts and team leaders are slightly higher, and generally they can expect an unconditional pay rise after two years.
Technology has clearly had an impact on the higher education industry, and it will undeniably continue to be a defining factor in the industry’s development. It is important that higher education service desks are able to keep up with the needs of university staff as well as their students’, and service desk leaders will also need to ensure their staff’s skill sets evolve alongside technology.